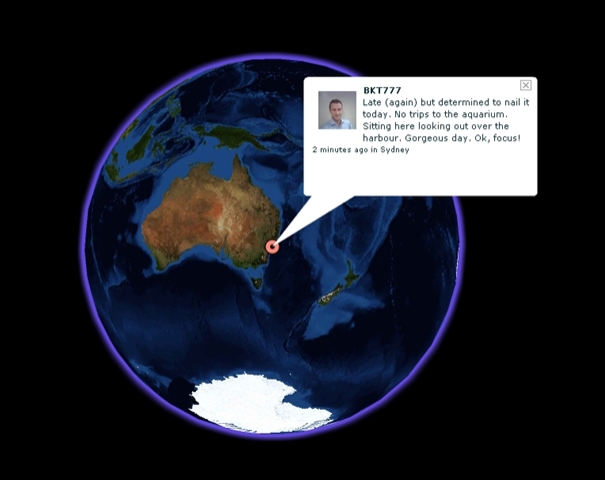
I was just pointed to Flickrvision, and I’m impressed. Flickrvision, and its older sibling, Twittervision, are program mashups by David Troy which combine the visualisation of Google Maps with the user-created data flowing out of Flickr and Twitter. There’s a ‘standard view’ in which individual Tweets or Flickr images are posted on a flat world map, but even more impressive for those visually-minded is the 3D version which inserts Tweets and Flickr photos continually onto a global map (which spins as needs be to show the origin of each post).
An example of Twittervision:
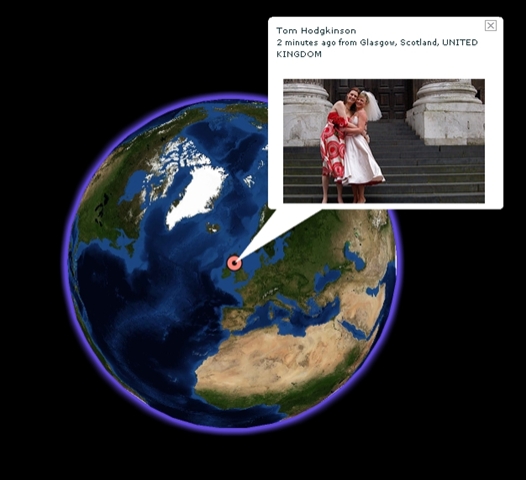
An example of Flickrvision:
Watching these globes spin, each showing a fragment of life around the world, is incredibly engaging. This is the user-driven web at its most visually enticing. I have to say, were I in charge of a Communications Studies or Media Studies department (which I’m not) and I could find a couple of spare monitors and computers (which, in all fairness, departments probably couldn’t), then I’d leave these running 24/7 in the front foyer; the best advertisement for the studying the user-driven web is watching it happen in all its visual glory, right in front of you!

